I’ve been a trainee at Statnett’s Data Science unit over the past months and learned a lot. In this post I will give you a quick look at what I have been working on, and some helpful advice for how to survive and thrive as a data science trainee.
I was put on a team together with colleagues from both Statnett and Svenska kraftnät, producing short-term time series forecasts. These forecasts automate several system operation tasks which are handled manually today, and are essential in the transition to a new Nordic balancing model. Specifically, my team is responsible for predicting power consumption and power imbalance (i.e. the mismatch between production and consumption). Every five minutes, we need to provide predictions for the next two hours, with high demands on robustness and data quality. This is not a one-man job, but here are some of the areas where I put my effort.
Building apps and developing models
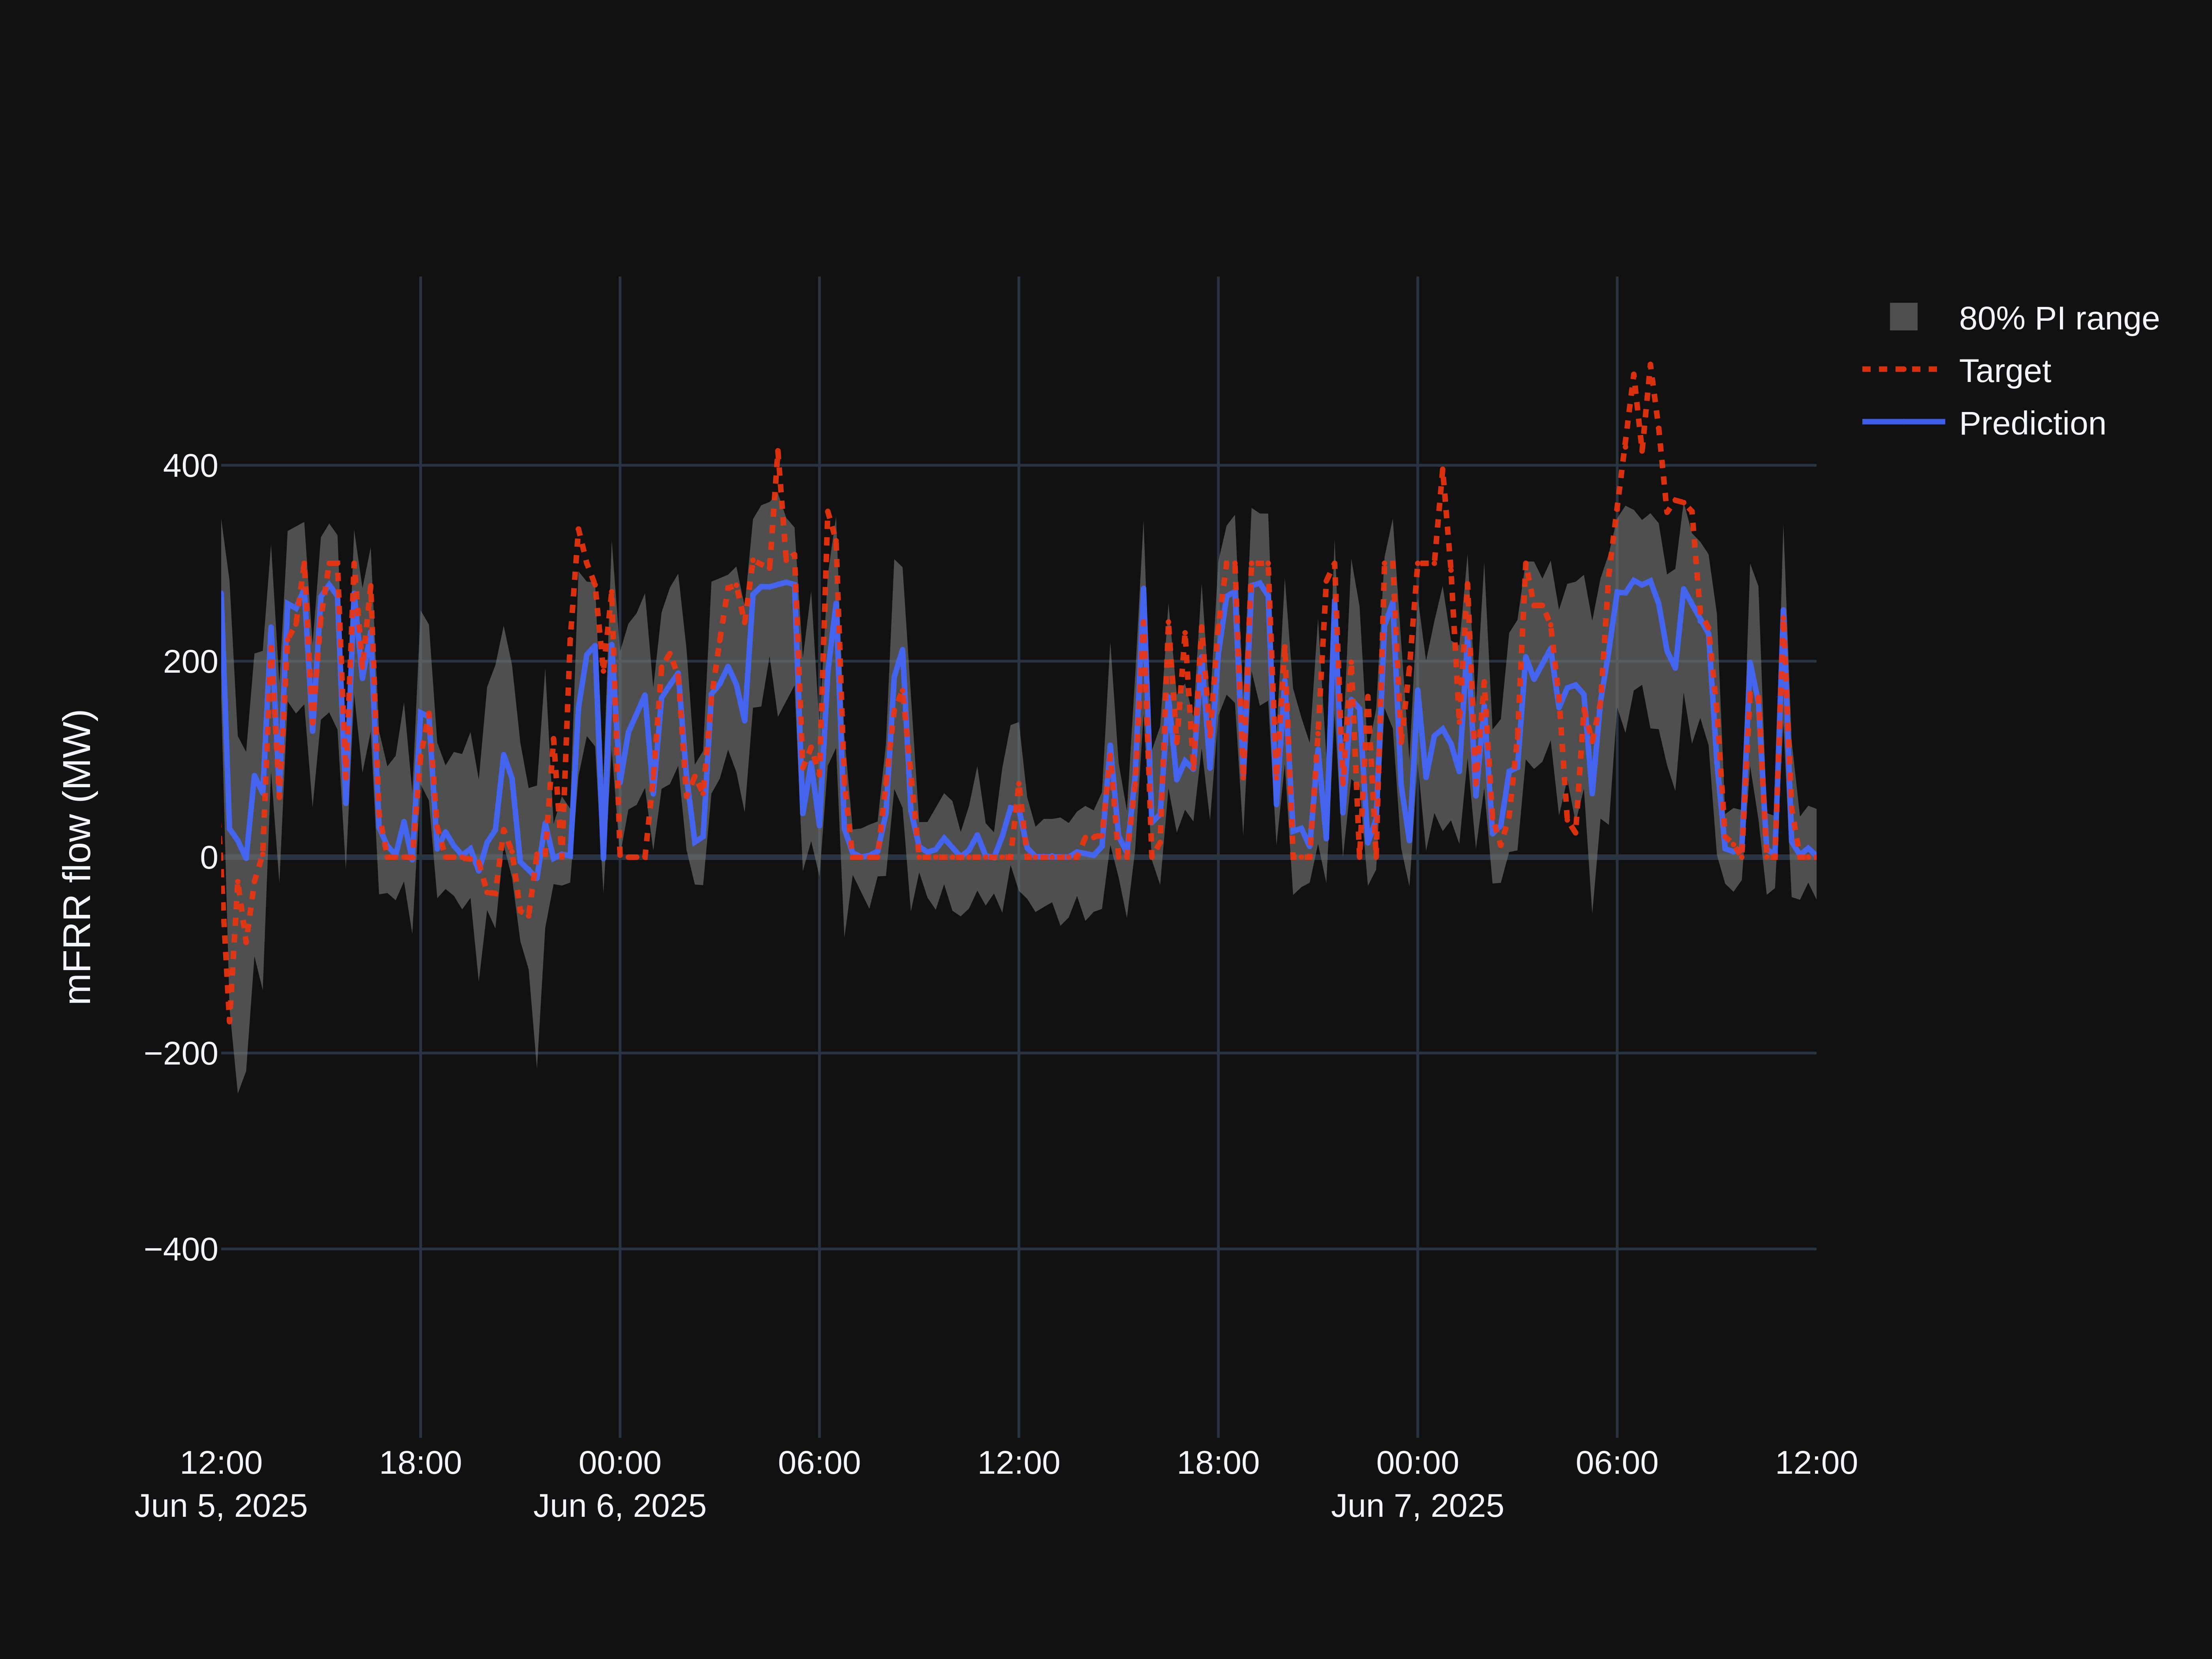
Our goal is to forecast the development of the system imbalance and power consumption in the near future. Statnett provides time series data describing power consumption, power production, power imbalance, weather forecasts and other relevant information. Utilizing these data, we can build mathematical models with machine learning algorithms that in the end are used to generate the predictions.

Currently, a linear regression with a ridge penalty has proven to be the superior choice at Statnett, but we always aim to discover new models to keep improving our forecasts.
As a fun way of developing new models, the team recently set up a classic clash. The Norwegians on the team competed against the Swedes in improving the current model. For a week, communication across the border dropped to a bare minimum as we worked with high intensity to win the competition. Most importantly, we learned a lot on how to improve performance. And almost as important, the Norwegians won…
Live monitoring of apps and data streams
When a prediction model is fit for purpose, we deploy it in our production environment. At Statnett, we orchestrate our application containers with OpenShift, a PaaS equivalent to Kubernetes, but with stronger security policies. We queue our data with Apache Kafka, not only to maintain data flow between components, but also to deliver our end-product. Other than that, we also rely on PostgreSQL, Kotlin and GitLab in our everyday development.
To make the transition into more automatic operation of the power grid as smooth as possible, we need to make sure that our services are running robustly. In an effort to keep the required uptime, we monitor our services, including the full machine learning pipeline, with Grafana dashboards.

This dashboard provides a convenient overview of the system end-to-end. The dashboard shows the flow between different components, and also the status of streams and apps, indicated by colors. This makes it easy to identify and deal with issues when they occur.
Happy team, happy life
I’ve discovered how to cope with the daily struggles of working as a programmer, especially when working from home. The most important is that you end up laughing (or at least smiling) a couple of times each day while working. If you find that hard to achieve, feel free to apply these well-proven steps:
Sync each other’s Spotify playlists
and regularly dance in your office. I think this is how silent disco was invented.
Speak Swedish to your Swedish colleagues
Say things like tjenare and grabben to Swedish people in meetings. They will laugh, I don’t really know why.
Put sunglasses on while programming

Ask about other people’s day
take 5 minutes just to talk, while performing some paint art

and last, but not least,
Do not push to the main production branch as a trainee
Please be careful. If you do this, and something goes wrong, some of the more senior employees may not fix it right away, and might even enjoy seeing you stress to fix the issue. It has not happened to me, but if it did, it would be difficult to recover from.


Leave a Reply